I worked on this analysis last night with Claude Code. Much of it was written by AI, all of it is edited by me.
March 12, 2026 — Conflict Day 12
Executive Summary
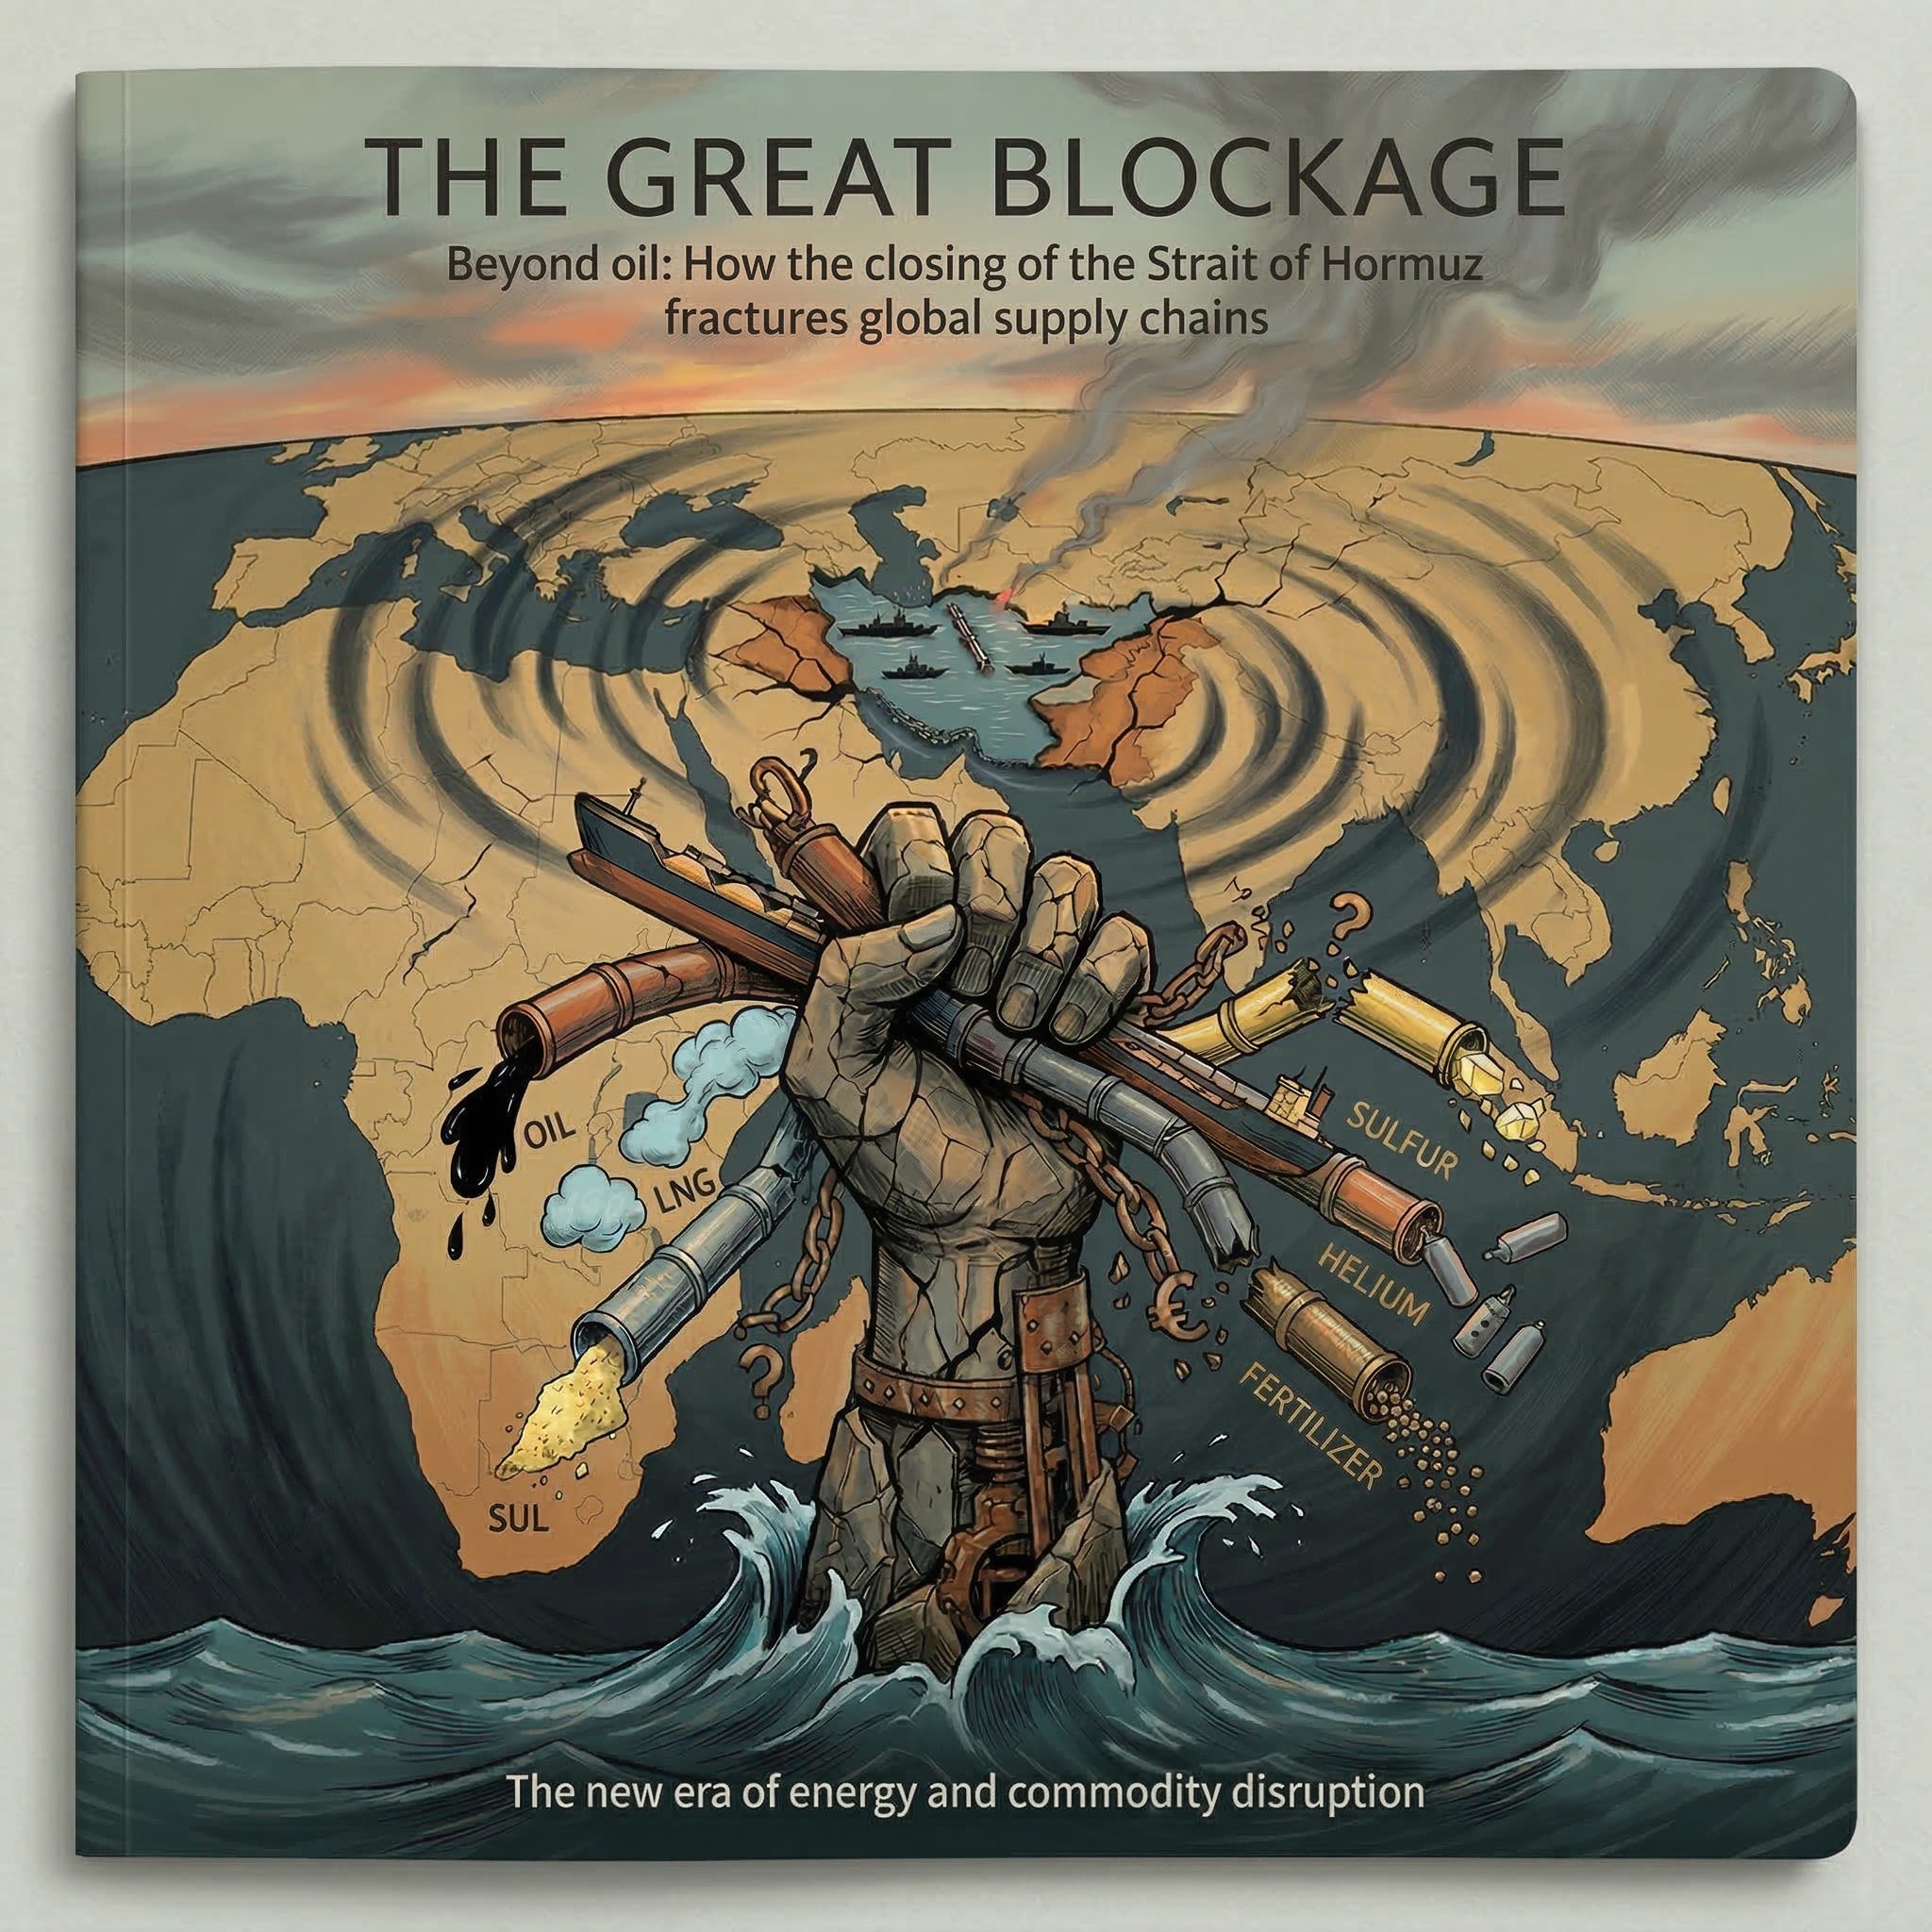
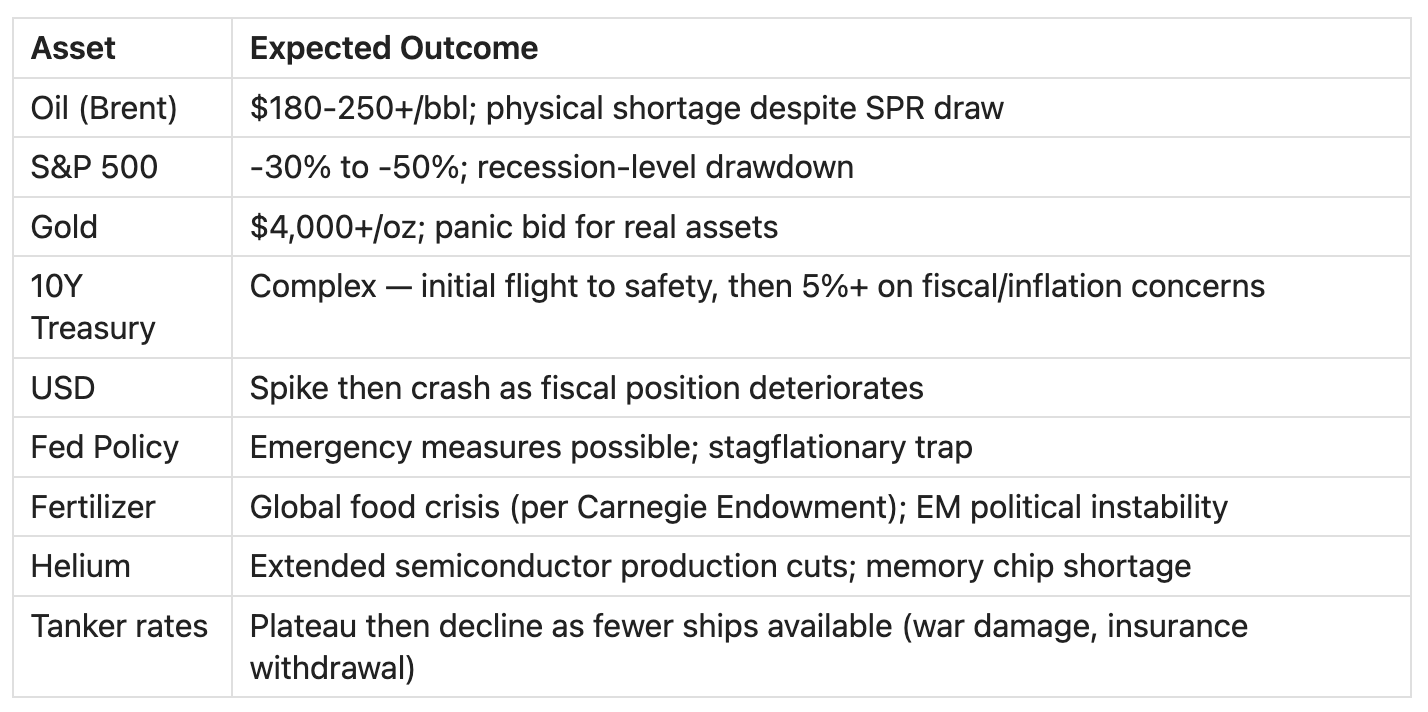
The US/Israel-Iran conflict (started Feb 28, 2026) has produced the most significant energy supply disruption since the 1973 Arab Oil Embargo. The physical closure of the Strait of Hormuz — not merely a threat — differentiates this from 1990 (Gulf War) or 2019 (tanker attacks). This is simultaneously hitting oil, LNG, sulfur, helium, and fertilizer supply chains — it is not a single-commodity event.
What’s happened so far:
Brent crude spiked from ~$60 to $120/bbl peak (100%), settling ~$92-100; WTI at ~$87+
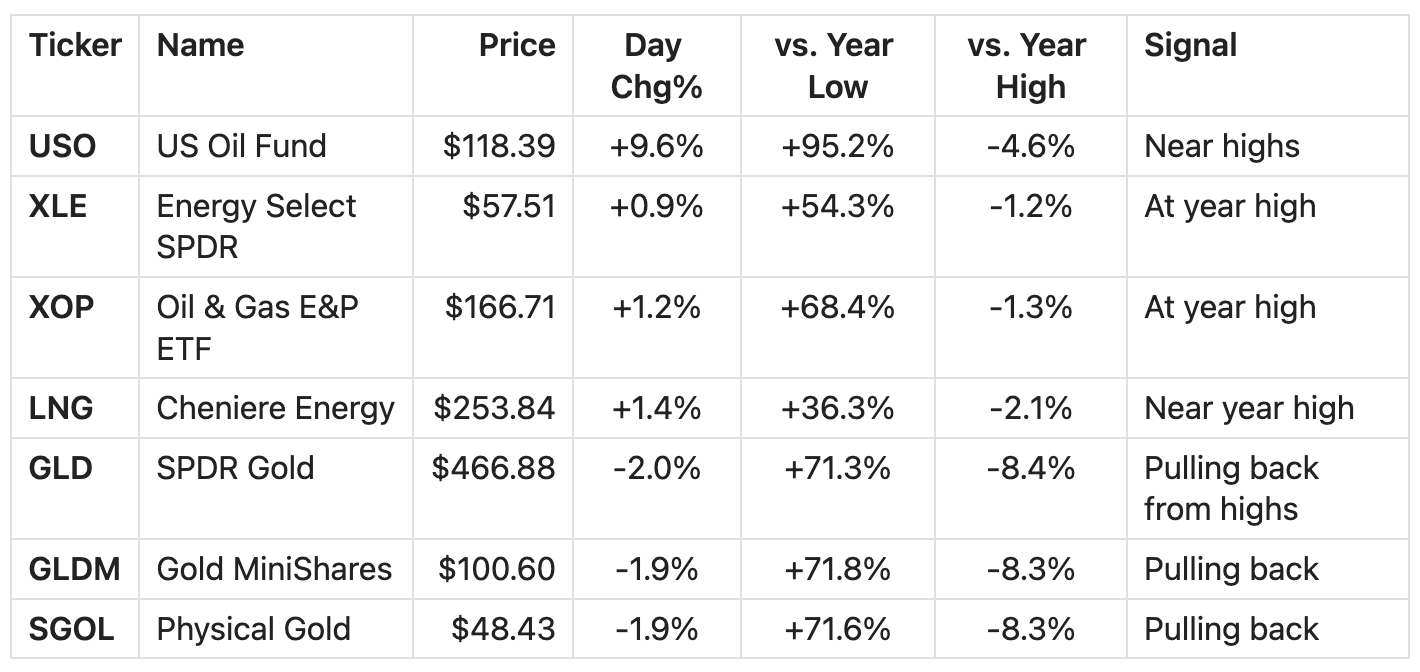
USO (oil ETF) at $118.39, up 9.6% today alone, near 52-week high of $124
S&P 500 down ~3% MTD, ~7% from Feb 10 record high (VOO at $612.50)
10Y yields at 4.26% on inflation fears; TLT at $86.97
IEA announced 400M barrel SPR release — the largest since 1973
Fed rate cut expectations collapsed: only one cut priced for December 2026
Dutch TTF (European gas) surged 38-54% on Qatar LNG facility damage
Tanker rates hit all-time highs: VLCC at $423,736/day, individual fix at $770,000/day
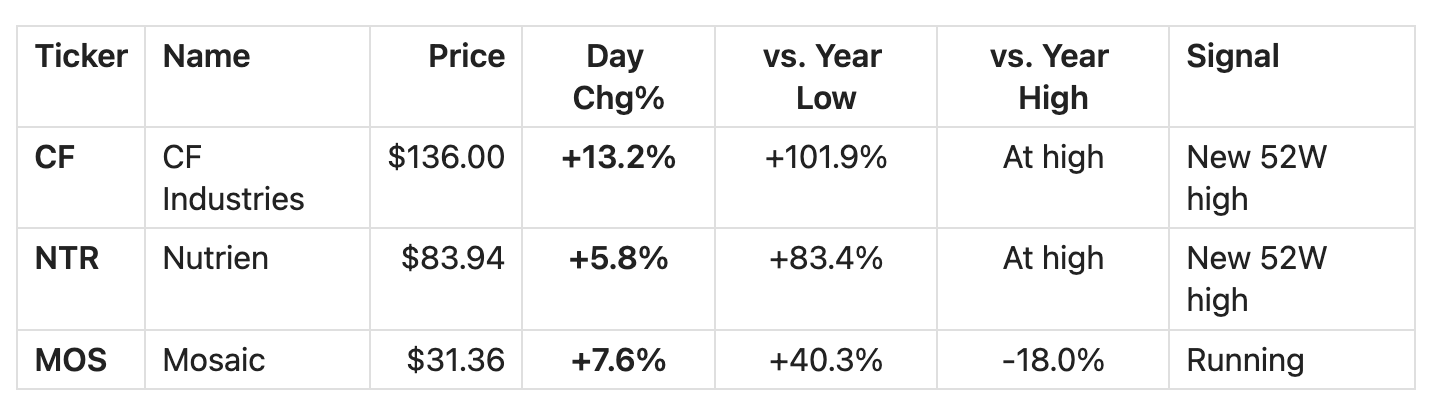
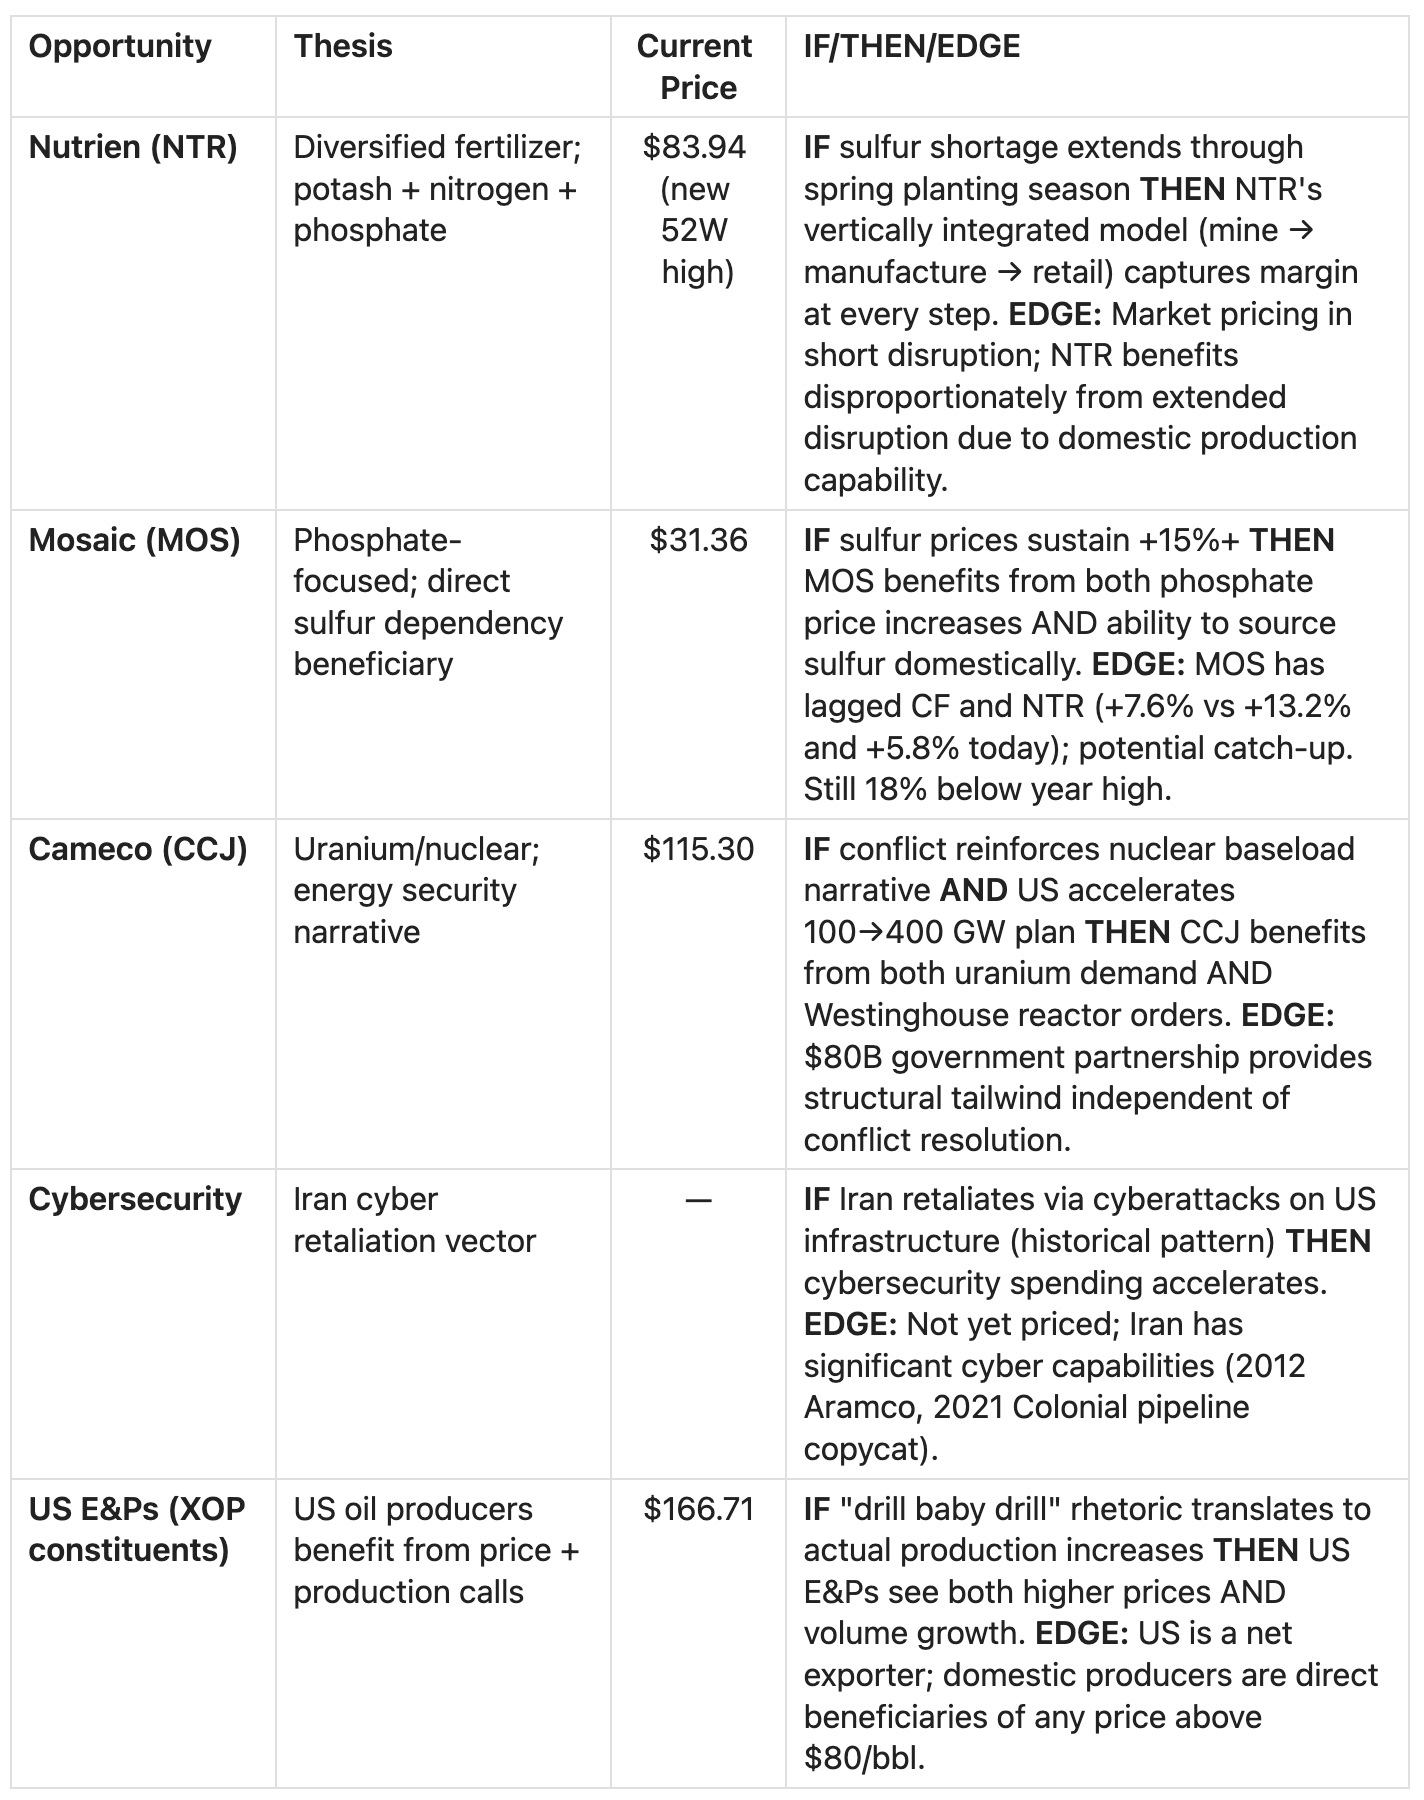
Fertilizer stocks surging: CF +13.2% today, MOS +7.6%, NTR +5.8%
Key finding: Duration is the critical variable. Markets are pricing in a weeks-to-months resolution. If the conflict extends beyond that, economic damage compounds non-linearly through inflation → food prices → EM instability → semiconductor supply chains.
Market Snapshot (March 12, 2026)
Energy & Commodities
Fertilizer (Second-Order Beneficiaries)
Defense
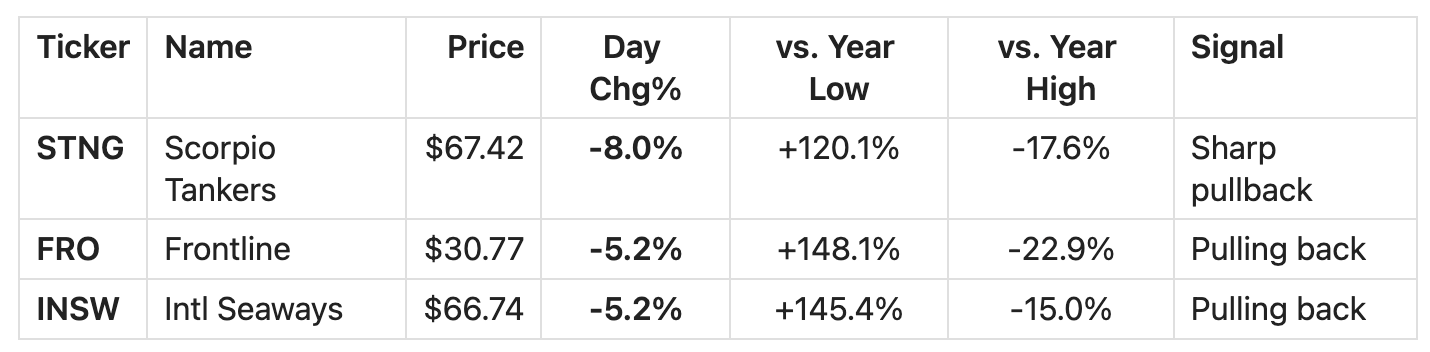
Tankers / Shipping
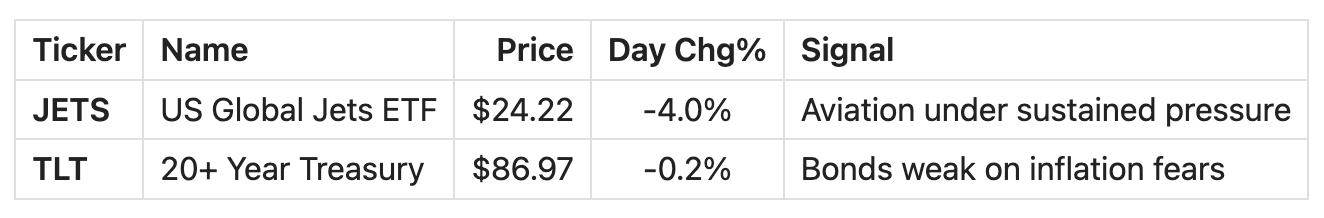
Losers
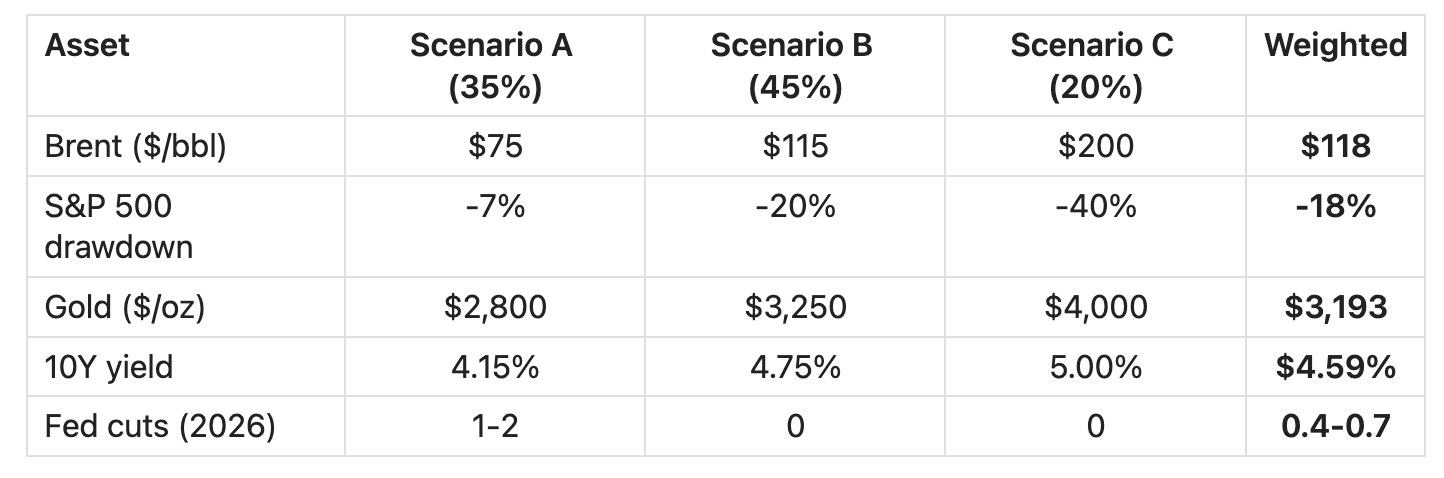
Scenario Framework
Three scenarios anchored by duration — the critical variable per historical analysis and current analyst consensus.
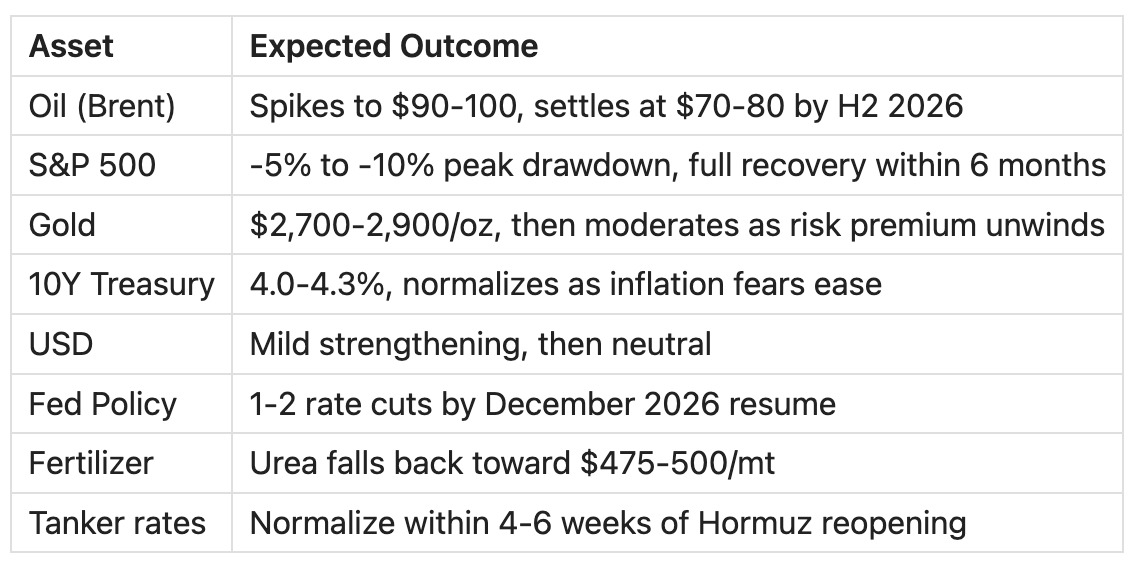
Scenario A: Swift Resolution (1-2 Months)
Probability: ~35% (derived from analyst consensus and Goldman Sachs’ relatively benign oil forecast)
Trigger: Diplomatic breakthrough via Oman/Geneva channel; ceasefire + Hormuz reopening. Trump envoys (Witkoff, Kushner) already conducting contacts.
Historical analog: 1990 Gulf War — sharp spike, quick resolution, +27% equity recovery over 12 months.
Scenario B: Extended Disruption (3-6 Months)
Probability: ~45% (base case — aligns with IEA’s 120-day SPR release timeline and most analyst scenarios)
Trigger: Military operations continue but don’t escalate to full regional war. Hormuz remains closed or severely restricted. Diplomatic progress slow. Iranian infrastructure damage prevents quick restart.
Historical analog: 1979 Iranian Revolution — oil doubled, stagflation, equities suffered initially, recovery as new trade flows emerged.
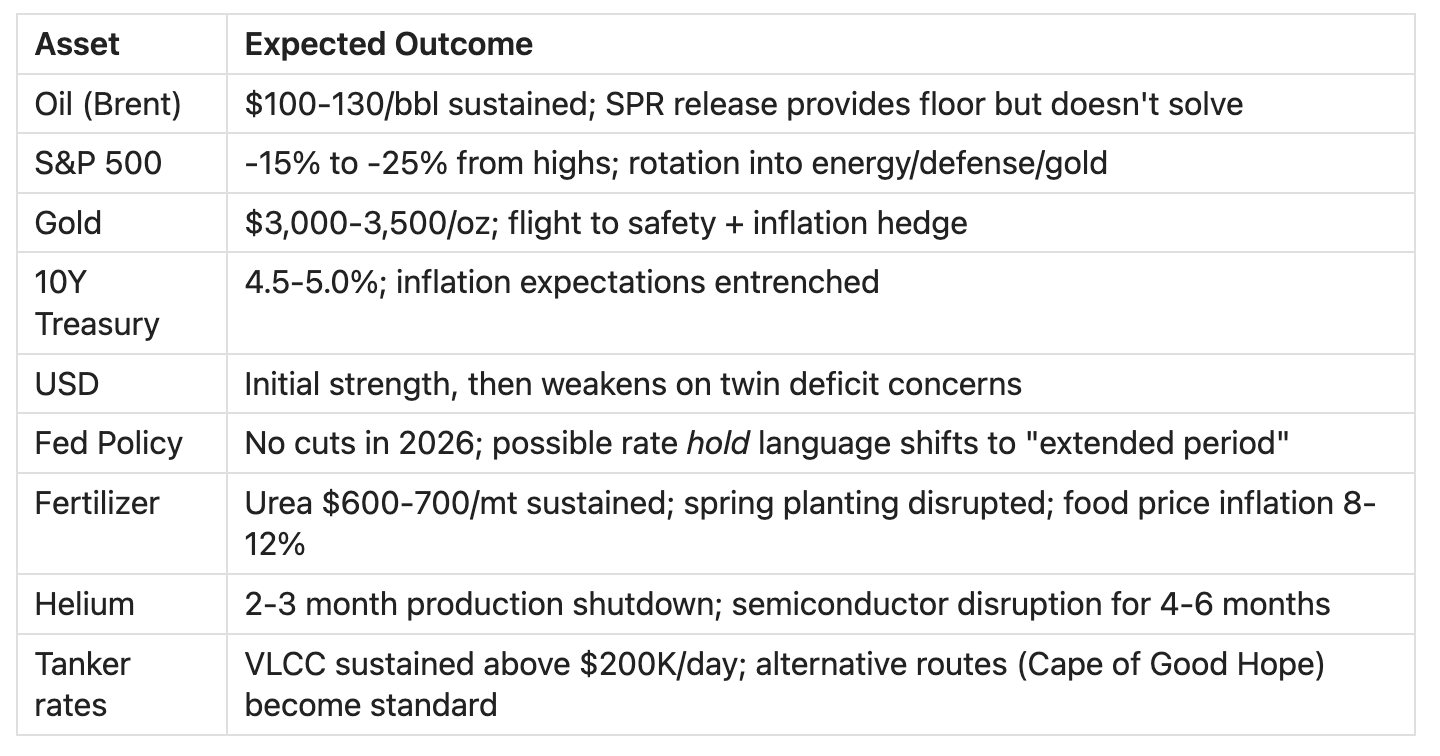
Scenario C: Escalation (6+ Months / Regional War)
Probability: ~20% (tail risk — requires significant escalation beyond current scope)
Trigger: Conflict expands to Saudi Arabia, UAE; Iranian attacks on Gulf state infrastructure; potential China/Russia involvement complicates diplomacy; nuclear dimension.
Historical analog: 1973 Oil Embargo — oil quadrupled, S&P -44% over 11.5 months, deep recession, structural inflation.
Probability-Weighted Expected Outcome
Historical Comparison
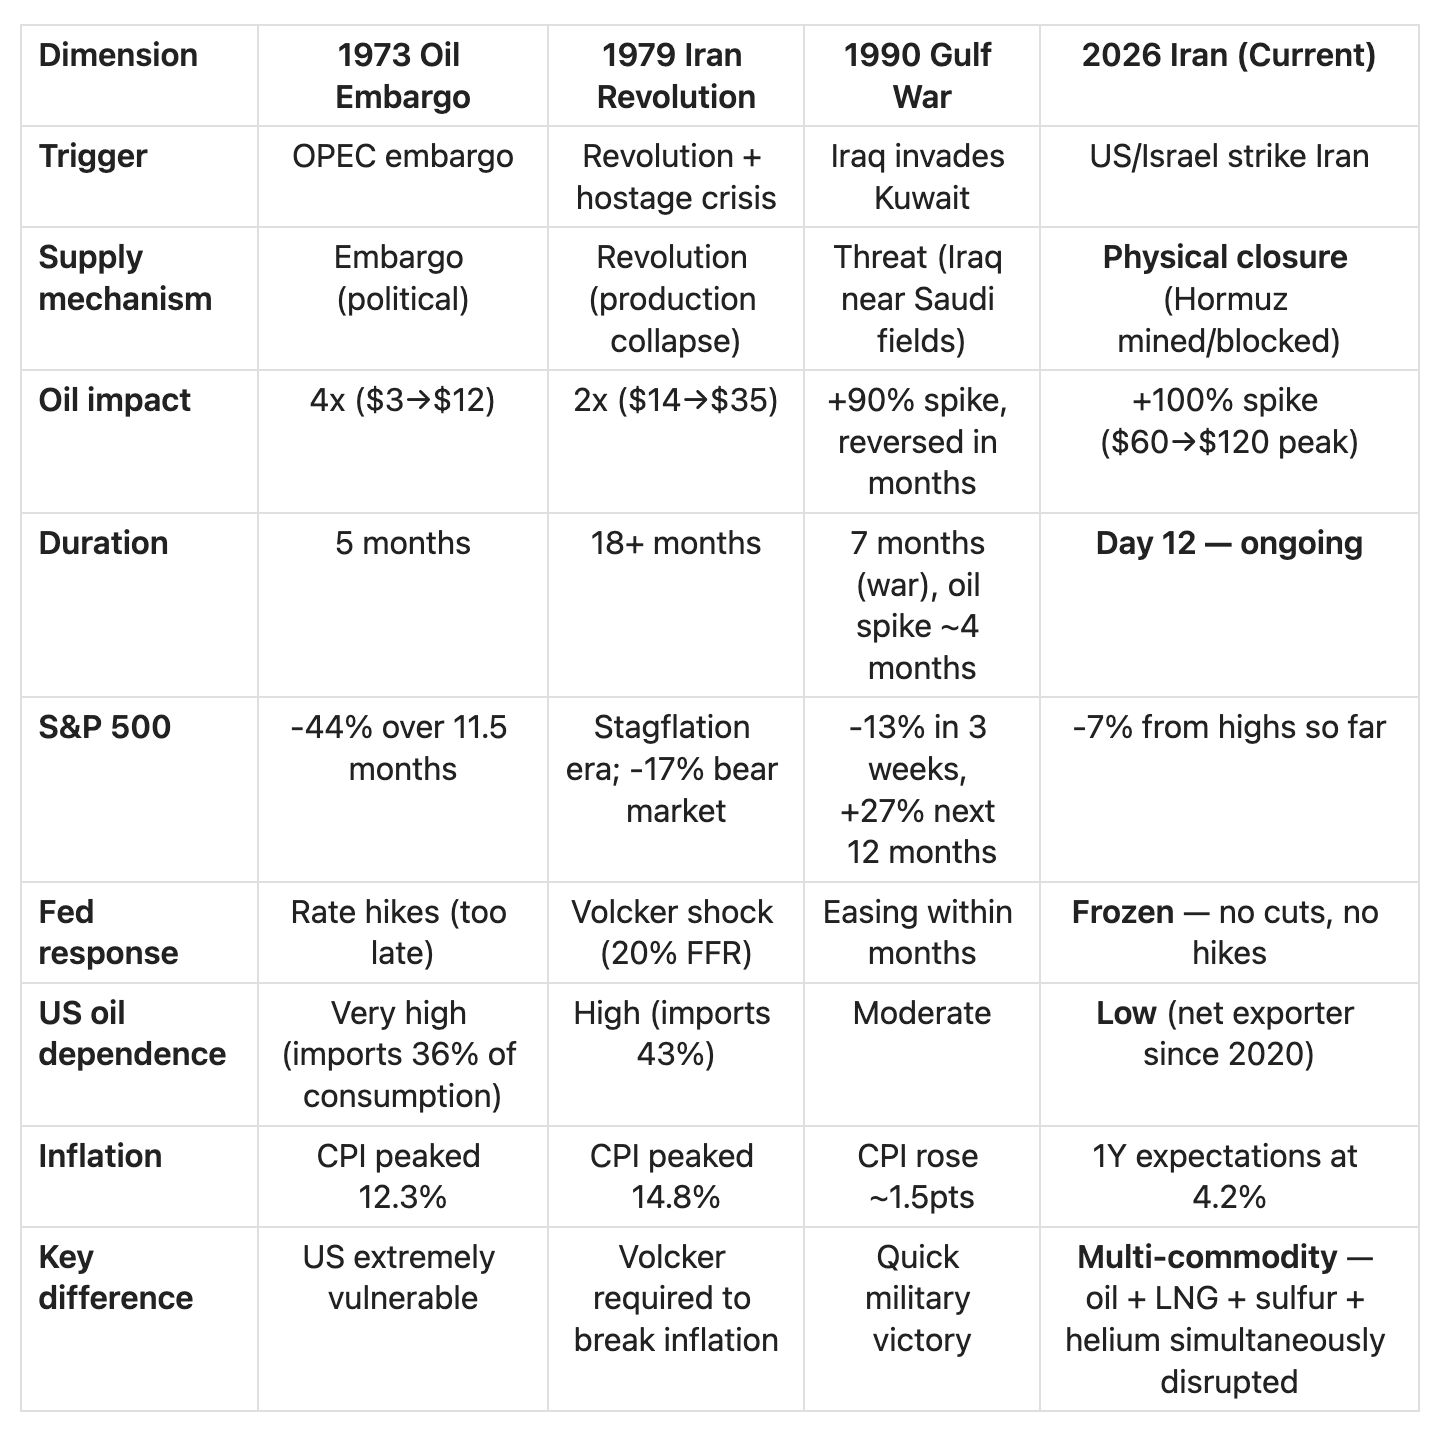
Critical insight: The US is far less oil-dependent today than in 1973 or 1979 (net exporter vs. major importer). This limits the domestic economic damage. However, the global transmission mechanism through LNG, sulfur, helium, and fertilizer supply chains creates risks that didn’t exist in previous oil crises.
Second & Third Order Effects
1. Energy → Inflation → Fed Policy → Credit
Oil at $126/bbl → ~1-1.5% added to CPI → Fed delays cuts →
Higher for longer rates → Credit spreads widen →
Leveraged businesses pressured → Default cycle risk
Current state: 1-year inflation expectations already at 4.2%. Fed funds futures price only one cut (December 2026). Multiple Fed officials (Collins, Goolsbee, Barkin) warning inflation is “too uncomfortably high” to cut. The stagflation dilemma: higher energy costs simultaneously crimp growth AND boost inflation.
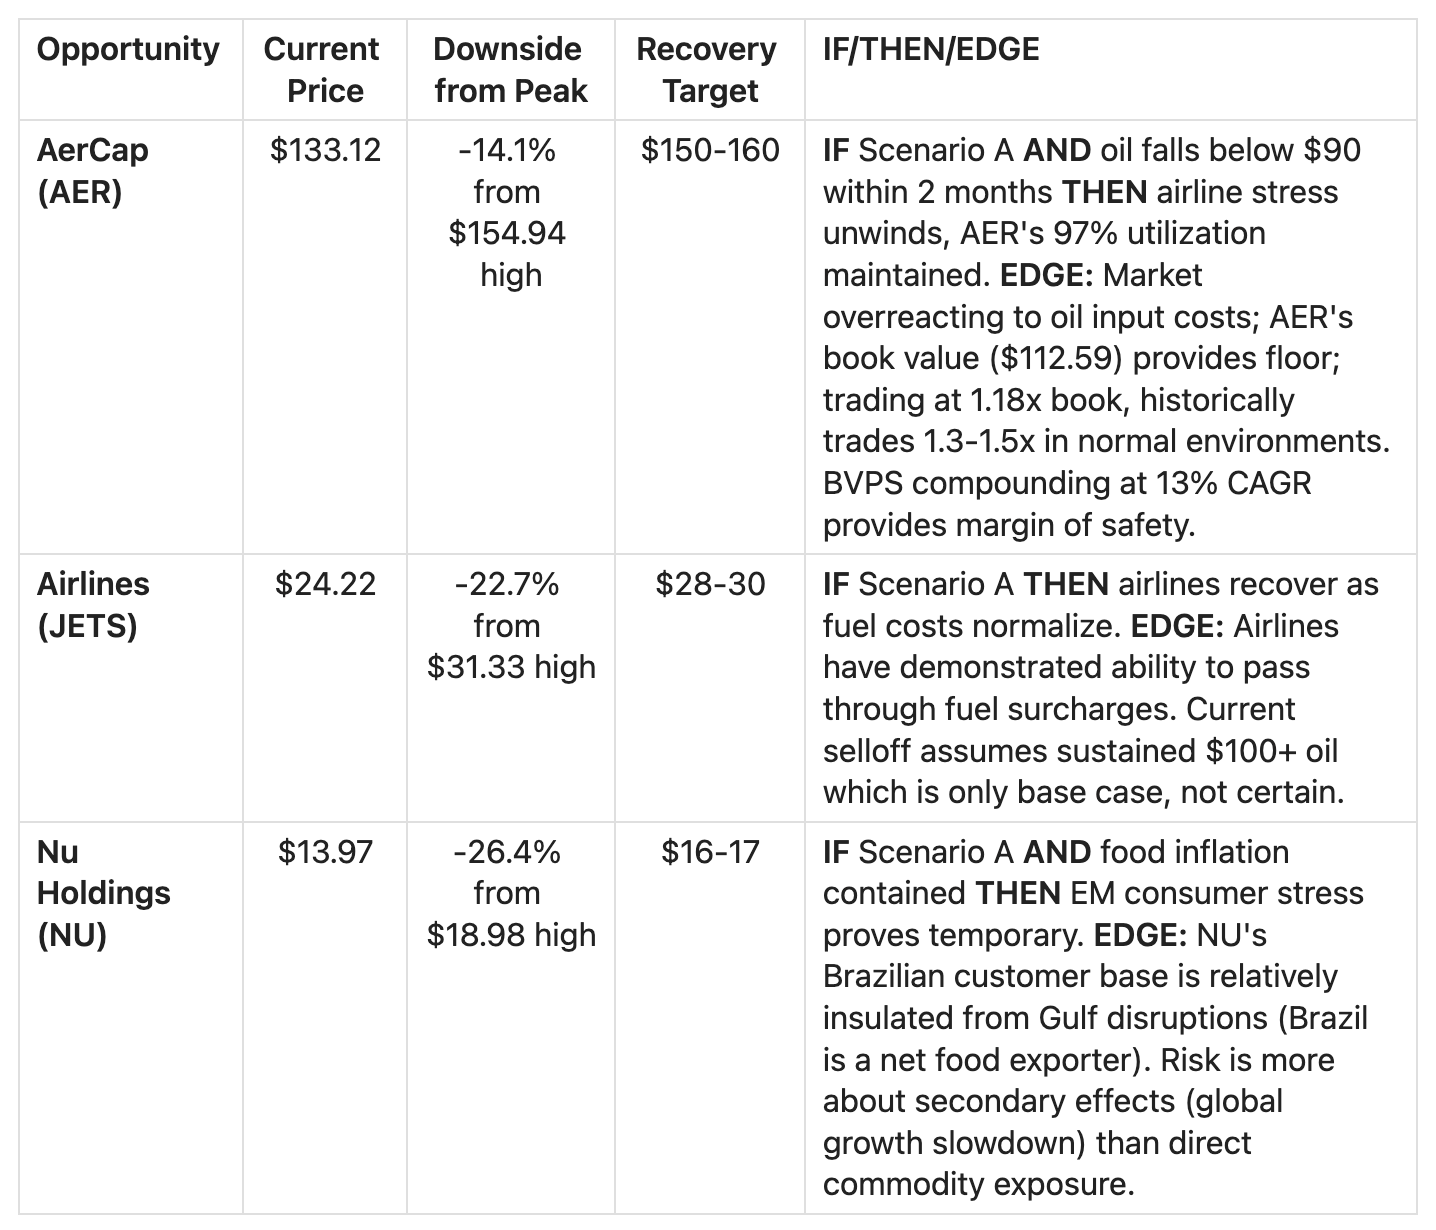
Investment implication: Avoid leveraged balance sheets. Favor businesses with pricing power and low debt. Chubb (CB) benefits from higher interest rates on float. AerCap (AER) faces higher debt servicing costs.
2. Sulfur/Fertilizer → Food Prices → EM Instability
Gulf produces 92% of global sulfur → Sulfur prices +15% →
Phosphoric acid fertilizer costs surge → Urea +30% (peak +44%) →
Northern Hemisphere spring planting disrupted → Food inflation 8-12% →
EM consumer stress → Political instability in import-dependent nations
Current state: CF Industries up 37% since conflict, Mosaic +6%, Nutrien +20%. Urea from $475/mt to $520-550/mt (peak $683/mt). Carnegie Endowment has flagged a potential “global food crisis” scenario.
Investment implication: CF (pure-play nitrogen) is the clearest beneficiary. NTR and MOS also positioned well.
3. Helium → Semiconductor Supply Chain
Qatar Ras Laffan drone damage → 30% of global helium removed →
Helium spot prices double → No viable substitutes for chip fab →
South Korea (64.7% helium from Qatar) most exposed →
SK hynix, Samsung memory production at risk →
4-6 month supply chain normalization timeline
Current state: Tom’s Hardware reports a “two-week clock” before helium disruption becomes critical for semiconductor fabs. No substitutes exist for helium in chip manufacturing (unlike neon after Ukraine). Analysts project minimum 2-3 month production shutdown and 4-6 months before supply chain normalizes.
Investment implication: Memory chip prices could spike if disruption extends. Semiconductor equipment makers may see delayed orders. Companies with diversified helium sources (US-sourced) relatively insulated.
4. Defense Spending → Fiscal Deficit → Bond Supply
$10B+ in first 10 days → $50B supplemental request →
Added to existing $1T defense budget → Higher Treasury issuance →
Bond supply pressure → Higher long-term yields →
Fiscal sustainability concerns compound
Current state: Pentagon has assembled a $50B supplemental budget request for Tomahawk missiles, Patriot interceptors, THAAD interceptors, and other depleted equipment. Speaker Johnson confirmed discussions. Congressional Democrats may leverage supplemental vote.
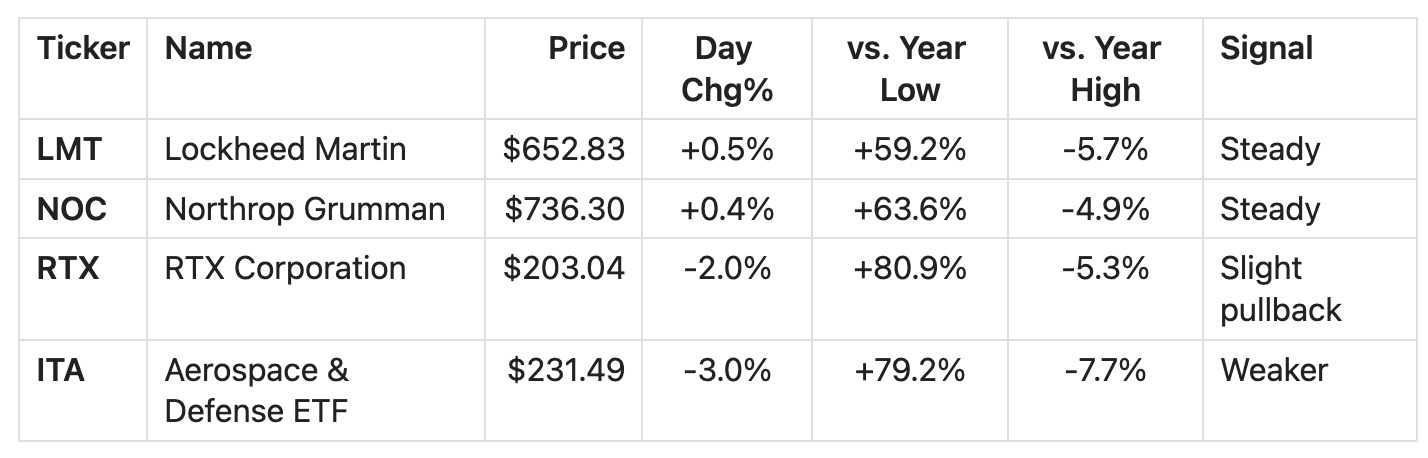
Investment implication: Defense primes (LMT, RTX, NOC, GD) benefit from replacement demand. TLT may face sustained pressure from increased Treasury supply. Long-duration bonds unattractive.
5. European LNG Disruption
QatarEnergy Ras Laffan damaged → 19% of global LNG exports removed →
Dutch TTF +38-54% in one session → Goldman raises gas forecast to EUR 55/MWh →
European manufacturing costs spike → Reopens 2022-style energy crisis →
European industrial competitiveness deteriorates further
Current state: Qatar is Europe’s second-largest LNG supplier. Wood Mackenzie estimates the disruption removes 1.5 Mt/week (2.2 bcm) from global LNG markets. EU gas storage at ~30% (Belgium at 25.5%, below average). Goldman raised European gas price forecast from EUR 36 to EUR 55/MWh.
Investment implication: Cheniere Energy (LNG) is a direct beneficiary — US LNG exporters become the marginal supplier to Europe (again). European industrials face cost pressure. US manufacturing relative advantage increases.
6. Currency Effects → Sogo Shosha Returns
Risk-off → USD strengthens initially → JPY also strengthens (safe haven) →
Sogo shosha earn commodity profits in USD/global currencies →
JPY appreciation erodes USD-denominated returns when converted →
BUT commodity trading spreads widen significantly → Net positive for earnings
Current state: Japanese trading houses benefit from both commodity price levels and volatility (trading spreads widen in dislocated markets). Mitsui’s Energy segment (18.8% of profit) and Mineral & Metal Resources (31% of profit) are direct beneficiaries. However, JPY typically appreciates during risk-off periods, which would reduce the USD value of JPY-denominated equity positions.
Investment implication: Net positive for sogo shosha earnings power, but portfolio mark-to-market may not fully reflect this if JPY appreciates significantly against USD.
Investment Opportunities
Tier 1: Direct Beneficiaries (Partially Priced In)
These have already moved significantly. The question is: is the current conflict duration fully priced?
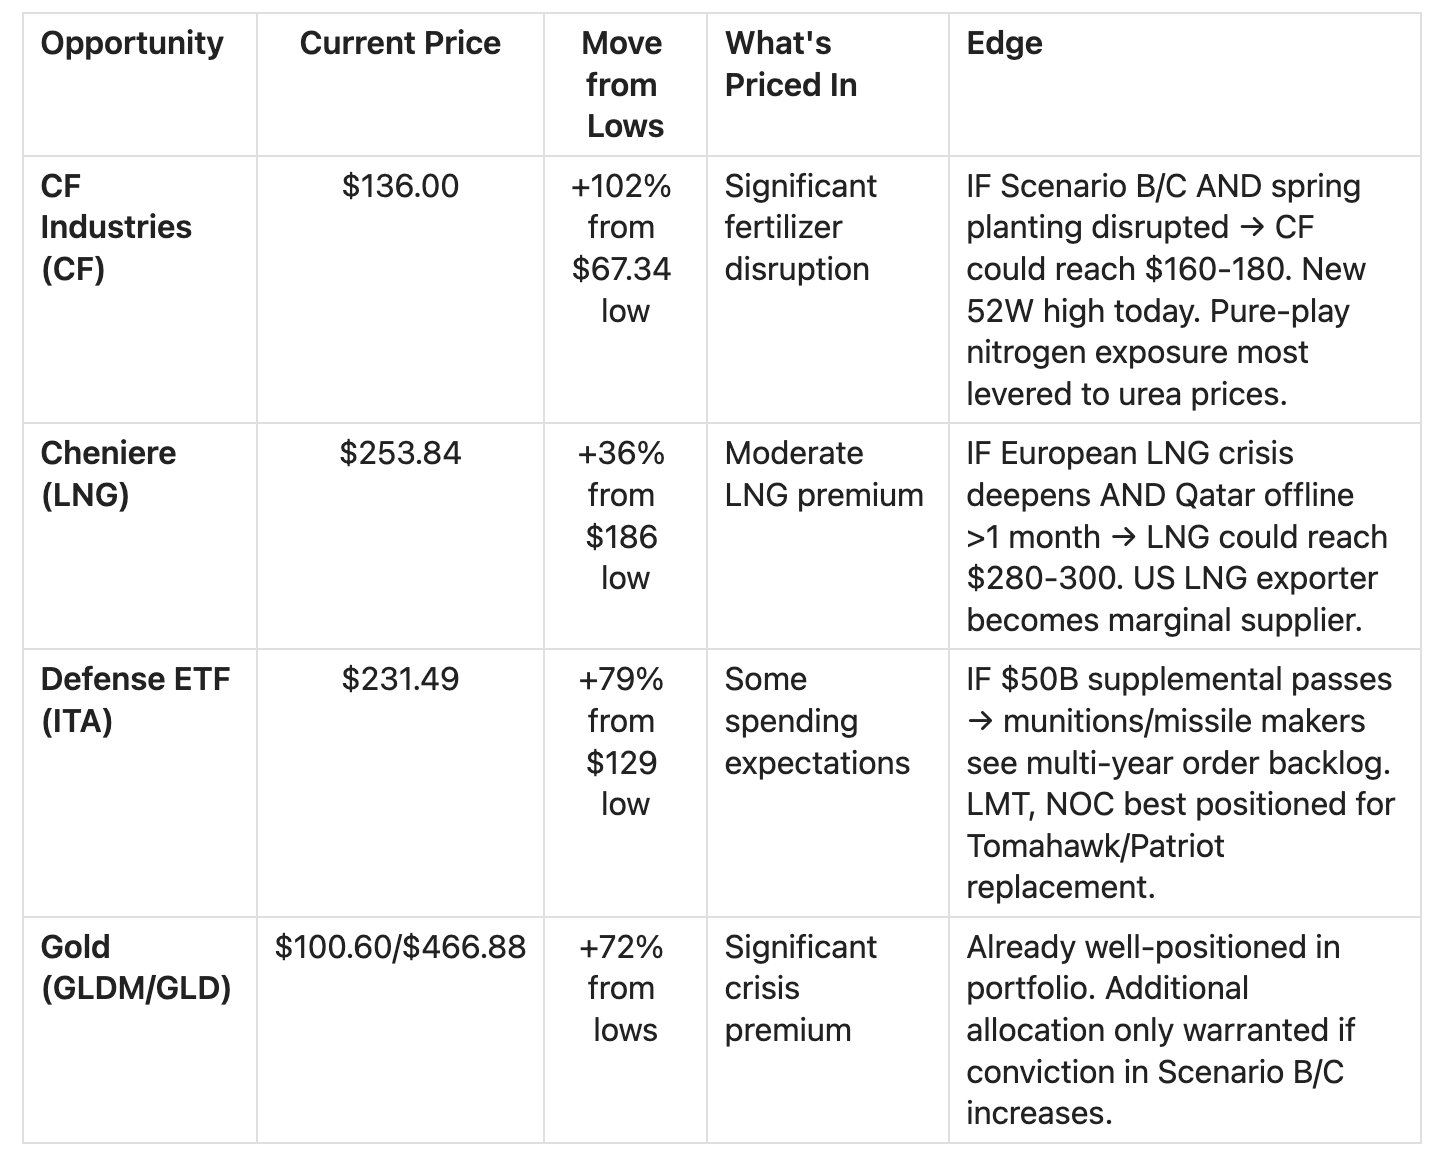
Tier 2: Second-Order Beneficiaries (Potentially Mispriced)
These are where the differentiated opportunities lie — effects most investors haven’t fully processed.
Tier 3: Contrarian Recovery Plays (IF Scenario A)
Only relevant if you have conviction in swift resolution (35% probability). These are oversold quality assets.
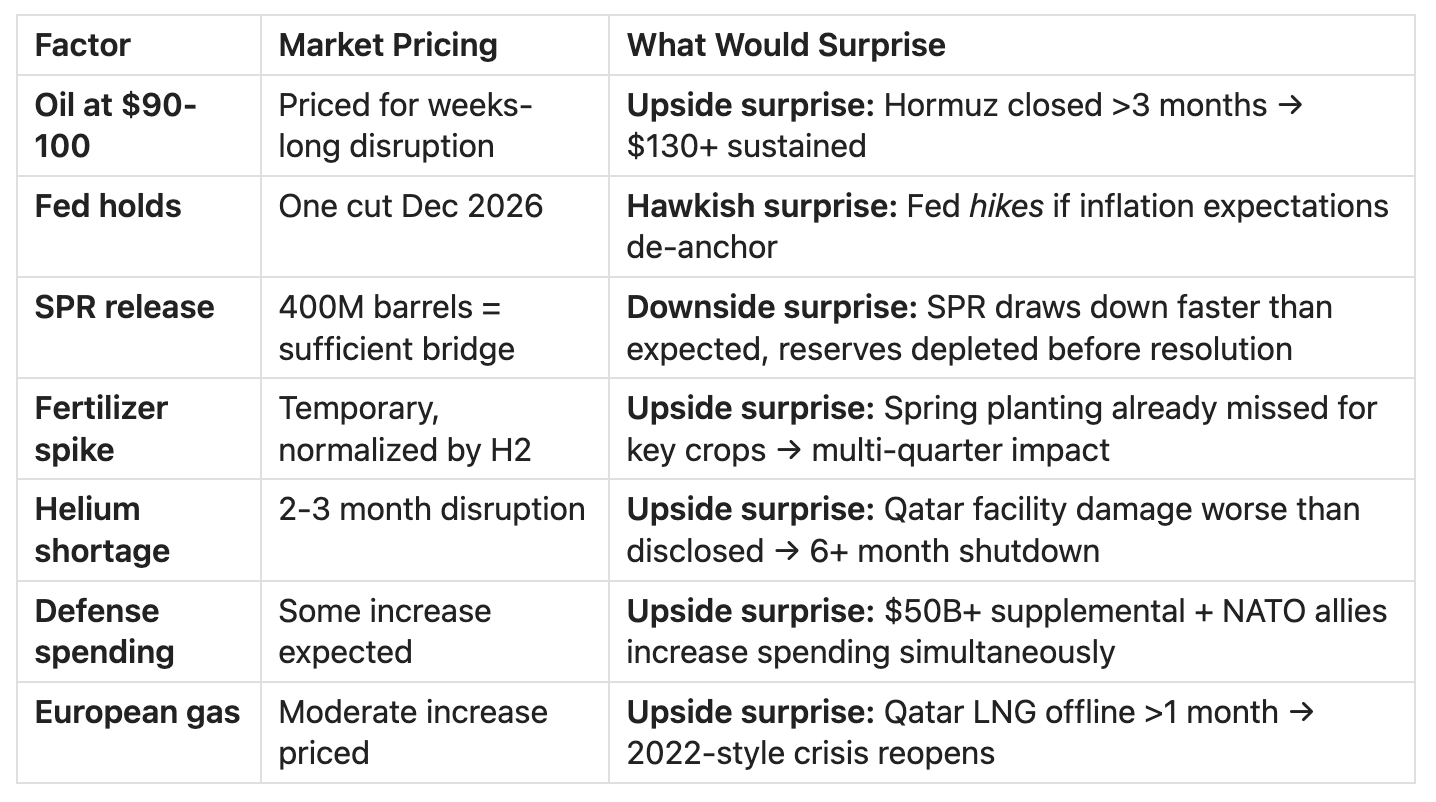
What’s Already Priced In (Key Assessment)
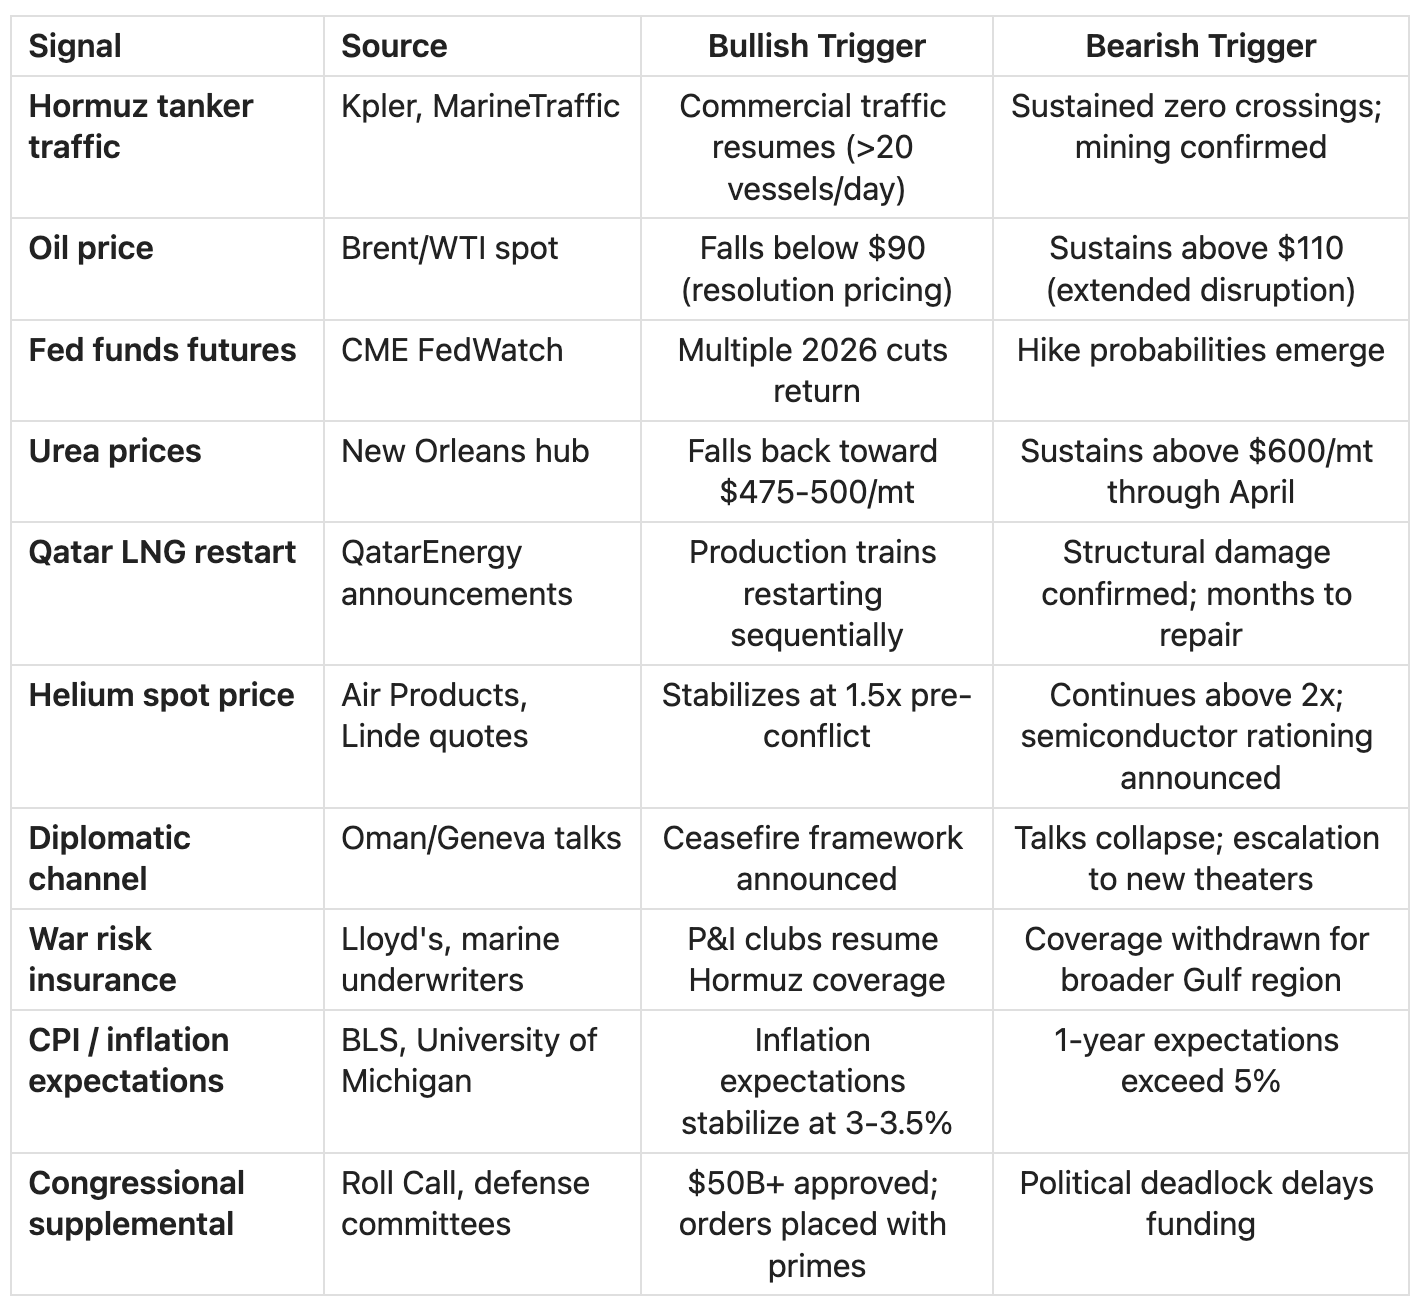
Monitoring Framework
Signals to Watch
Key Risks to This Analysis
Resolution speed: If diplomatic breakthrough happens faster than expected (next 7-10 days), energy/fertilizer longs will reverse sharply. The risk of being wrong on timing is asymmetric — being early to sell recovery plays costs less than being late to hedge.
US net exporter status: The US is structurally less vulnerable to oil shocks than in 1973/1979. Domestic economic impact may be overstated by simple historical comparisons.
SPR effectiveness: 400M barrel release is unprecedented. It may be more effective at moderating prices than skeptics assume, particularly if commercial inventories remain adequate.
Iran’s actual military capability: Market may be overpricing Iran’s ability to sustain a Hormuz closure against US Navy operations. Minesweeping and escort convoys could partially restore traffic.
China wild card: China is both Iran’s largest oil customer and a major Gulf importer. China’s diplomatic posture and willingness to facilitate or complicate resolution is a critical unknown.
Analysis based on data as of market close March 12, 2026. All prices from FMP API. Analyst estimates from Morgan Stanley, Goldman Sachs, JP Morgan, Bloomberg Economics, Allianz, and other sources via web search. Kalshi prediction markets were checked but showed no live pricing (illiquid markets).
This is a research memo, not investment advice. All scenarios are speculative and probabilities are estimates.